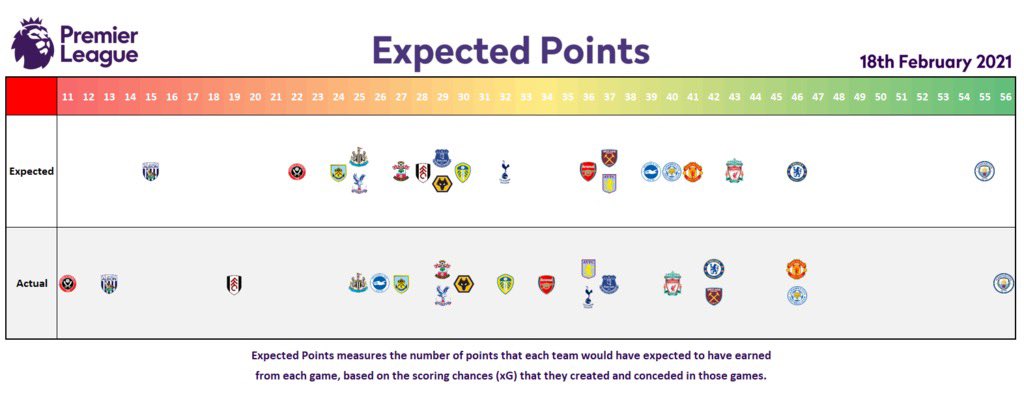
I always find this expected points such a weird measure. My understanding is what they do is they take each game’s expected goals statistics, run a Monte Carlo simulation and award the most likely results based on the simulations. But what you effectively end up with is a discrete xP for each game based on a highly variable measure. And then you add all of these up and end up with a league table. So our simulation vs Leeds would’ve taken the mean of 2,5 xGA vs 1,1 xGA.
I know the Monte Carlo helps - I’ve used them for work, but it’s helpful to know that you are taking 24 very volatile data points and adding them up.